Crypto analyst Victor Olanrewaju says it is possible for SOL to run longer distance. Analyst Abiodun Oladokun predicts that a booming meme coin will go beyond the ATH level. Analyst Michael Ebiekutan points further ahead for the leading altcoin.
SOL price forecast: Double-digit increase possible for altcoin!
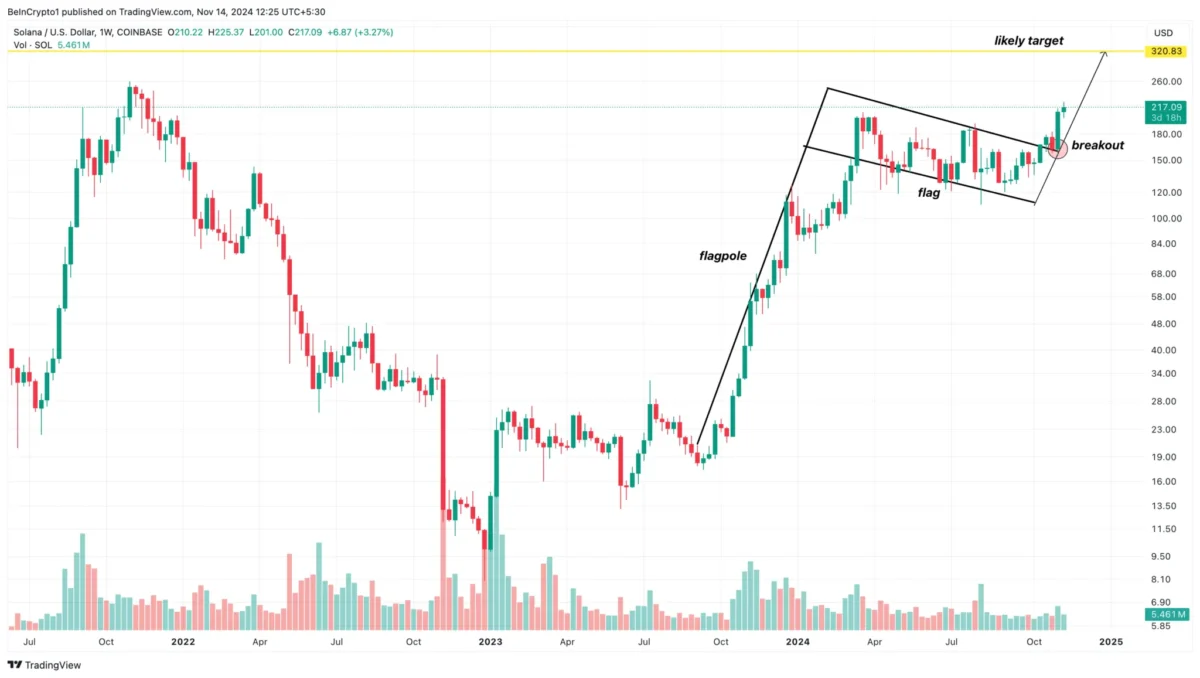
The altcoin price rose as high as $200 on 13 November. However, Solana reached $220 in the last 24 hours as a result of Robinhood’s decision to relist the token. Following the latest development, Solana exited the bull flag on the weekly chart. A bull flag is a pattern characterised by two upward rallies with a short consolidation period in between. The pattern starts with a steep price rise (the ‘flagpole’) as buyers overpower sellers, followed by a pullback forming the parallel upper and lower trend lines that form the ‘flag’.
As we can see from the chart below, SOL has broken out of the bull flag. It also briefly touched $220 before its recent decline reached $217.52. If the technical pattern remains the same, the altcoin price could break above the all-time high of $260, with its medium-term target possibly reaching $320.83.

PNUT price prediction: Will the meme coin retake the ATH level?
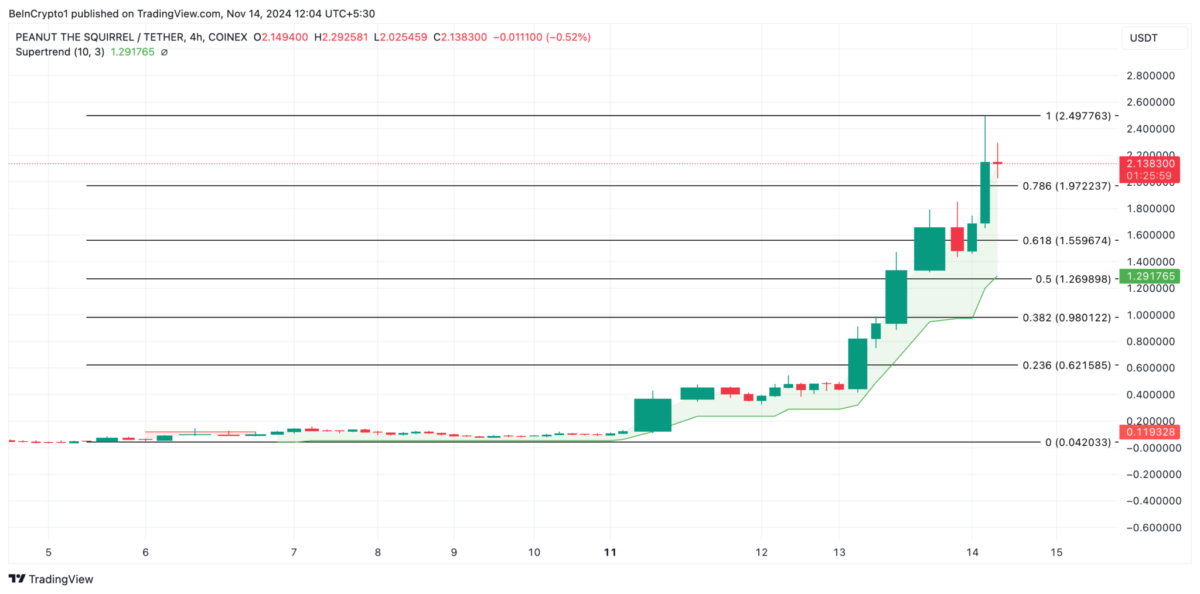
With buying pressure strengthening as reflected by PNUT’s Super Trend and Aroon indicators, the meme coin has the potential to extend its triple-digit gains. According to Fibonacci Retracement readings, PNUT’s next price target is $2.49, an all-time high if the uptrend continues. It is also possible that continued buying pressure could take it beyond this peak.

However, if profit-taking begins, the altcoin price is likely to lose some of its recent gains. In this scenario, it is possible that the price could fall as low as $1.55. If this level fails to hold, there is further support at $1.29, the green line of the Super Trend Indicator.
Ethereum price prediction: Leading altcoin targets ATH!
ETH needs a strong move above $3,307 to rise to $3,732. The altcoin price fell slightly after liquidating $95.51 million in the last 24 hours, according to Coinglass. Moreover, the liquidated long and short positions were $63.05 million and $32.45 million, respectively. ETH is retesting the $3,307 resistance on the daily chart after a small drop on Tuesday. If the leading altcoin maintains a strong move above $3,307, it could rise to test the resistance level near $3,732. ETH will tackle its yearly high resistance of $4,093 once it breaks above $3,732. Moreover, it will then target the all-time high.

On the downside, there is support for ETH near the exponential moving average (EMA) blue line. ETH is likely to bounce from $2,817 if support fails. The Relative Strength Index (RSI) bounced off the oversold line. This suggests that the bullish momentum is increasing. However, a drop below this zone is likely to cause a price correction. The Awesome Oscillator (AO) also posted successively increasing green bars above its neutral level. Thus, it signalled strong bullish momentum. However, the daily candlestick closing below $2,817 invalidates the bullish thesis.
The opinions and forecasts in the article are those of analysts and are not investment advice. As Kriptokoin.com, we strongly recommend that you do your own research before investing.
Follow us on Twitter, Facebook and Instagram, and join our Telegram and YouTube channel to stay up to date with breaking news !


